Customer Segmentation with Dimensionality Reduction and Clustering
Project Overview
Dimensionality Reduction with PCA: Handling high-dimensional data can be challenging. To streamline the data while preserving essential information, I employed Principal Component Analysis (PCA). This technique effectively reduced the dimensionality of the features, making the data more manageable for subsequent analysis.
Customer Segmentation with K-means Clustering: Leveraging K-means Clustering techniques, including the Elbow Method and Silhouette Score, I successfully grouped clients into unique segments based on their individual characteristics. This segmentation offers valuable insights for businesses to customize their offerings and strategies to cater to the distinct needs of each customer group.
Part 1: Exploratory Data Analysis (EDA) and Data Preprocessing
While the EDA part of this project wasn’t extensive, the focus was on robust data preprocessing and transformation. I encountered challenges and had to redo preprocessing several times to generate an appropriate dataframe for PCA. These efforts were essential to ensure the data’s quality and reliability.
I created several aggregated features from existing ones, such as Age, Day_Enrolled, Total_Cost, and Dependents. These new features provided a more comprehensive view of customer characteristics.
Part 2: Dimensionality Reduction - Principal Component Analysis (PCA)
PCA played a pivotal role in this project. The selection of the number of components was guided by two key criteria:
-
Total Variance Criterion: I aimed for 50-70% Cumulative Explained Variance, ensuring a balance between dimensionality reduction and information preservation.
-
Kaiser Criterion: Eigenvalues greater than 1 were considered, as they indicate significant information retention.
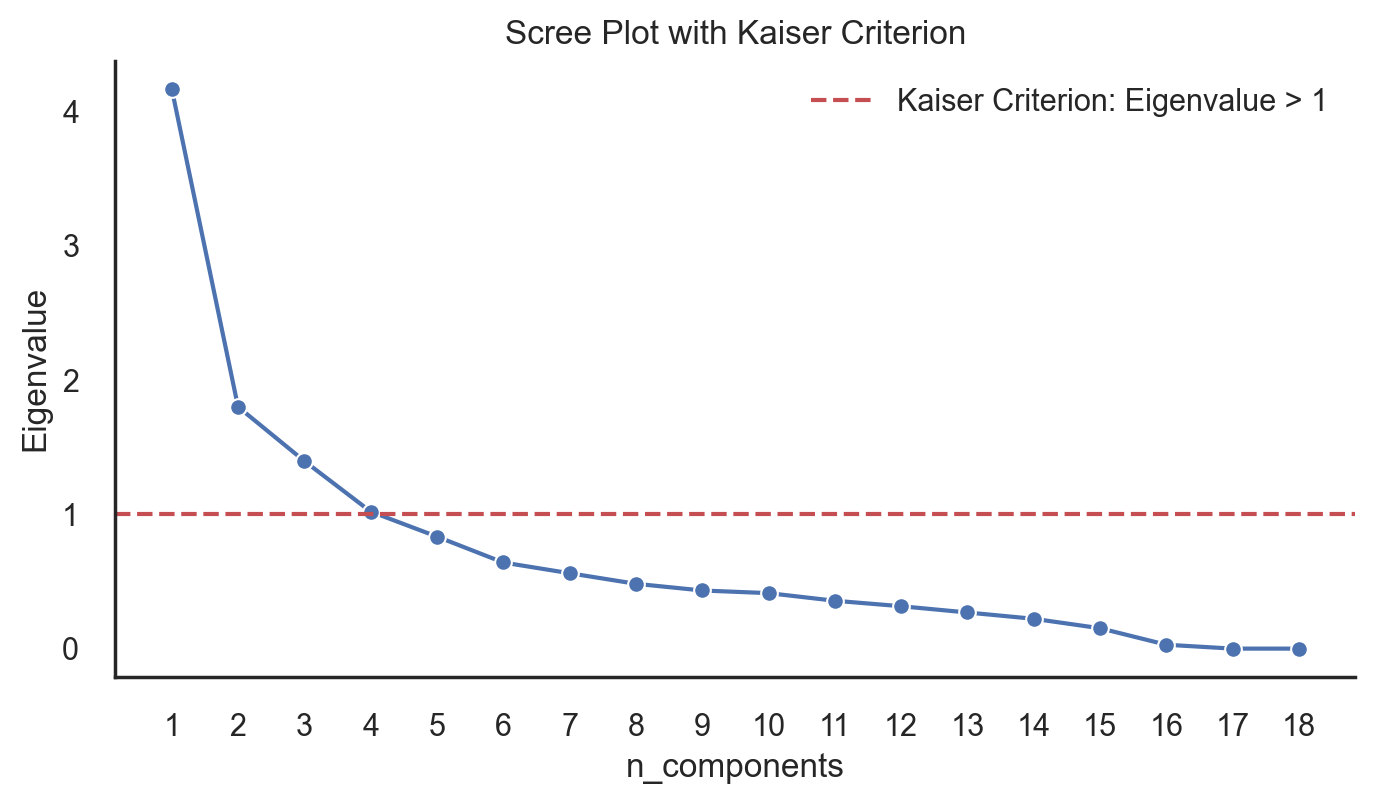
And I have found the ideal number of components are 4 and move to the building model stage.
Part 4: K-means Clustering & Customer Segmentation
K-means Clustering
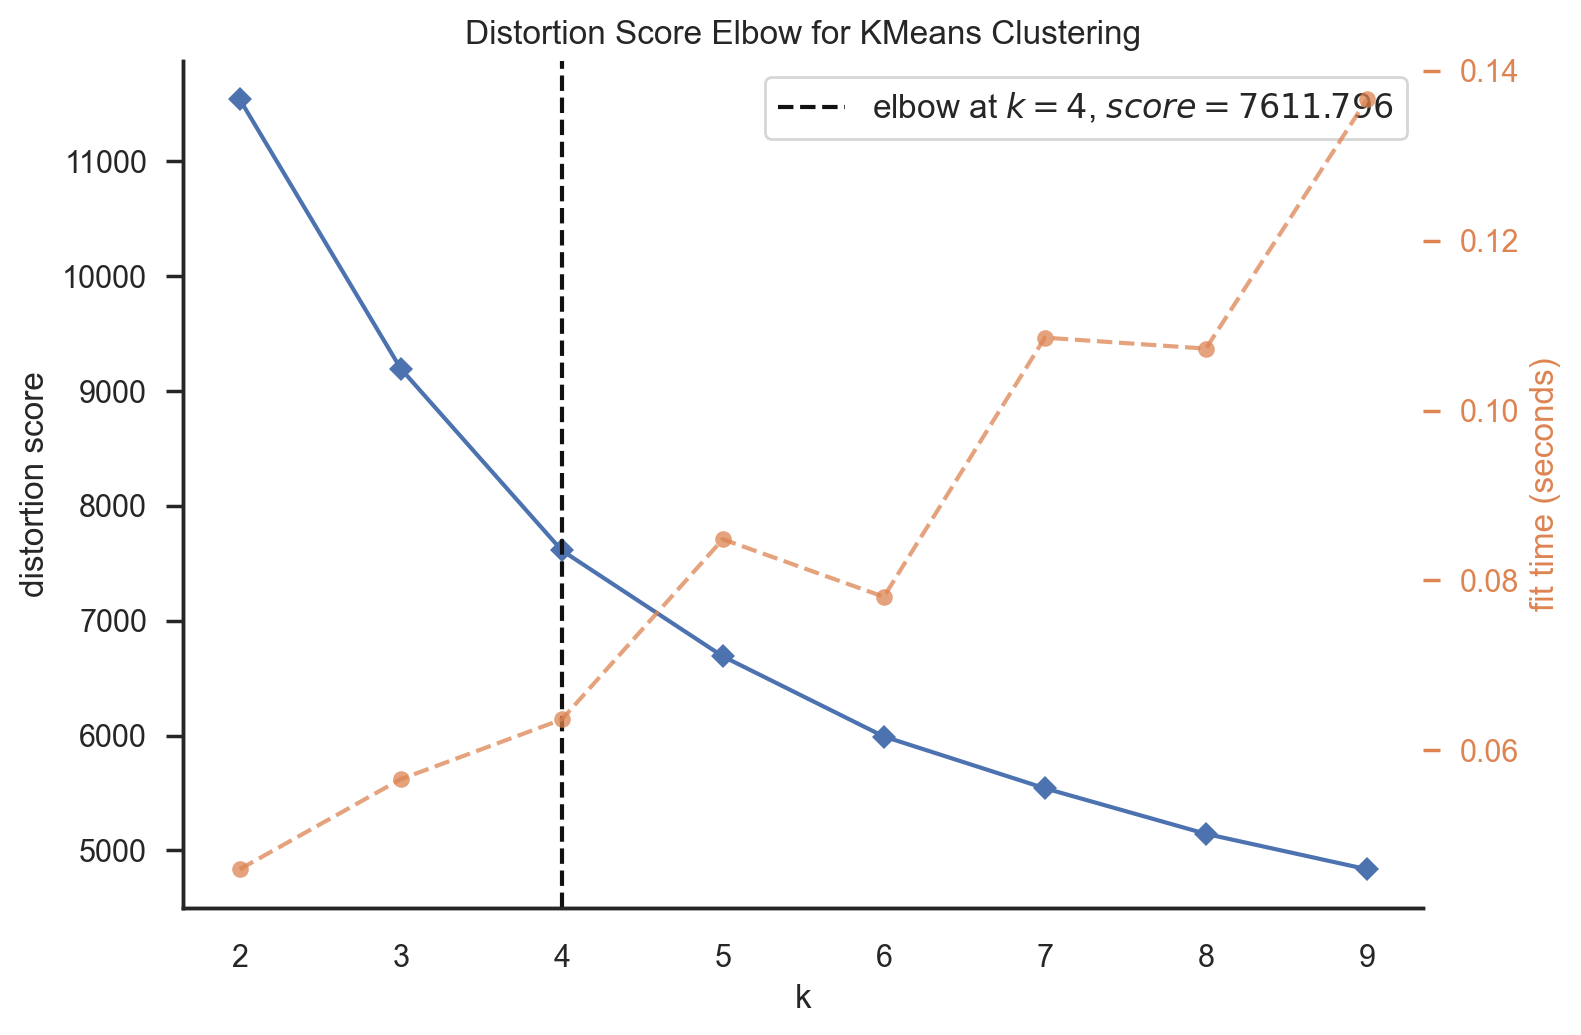
Determining the optimal number of clusters (K) was a crucial step. I utilized two methods:
- Elbow Method: This technique helped identify the “elbow” point on the plot of within-cluster sum of squares (WCSS) versus the number of clusters. The elbow point signifies an optimal K value.
- Silhouette Score: The Silhouette Score measures the quality of clustering. I aimed for a higher Silhouette Score to validate the chosen K value.
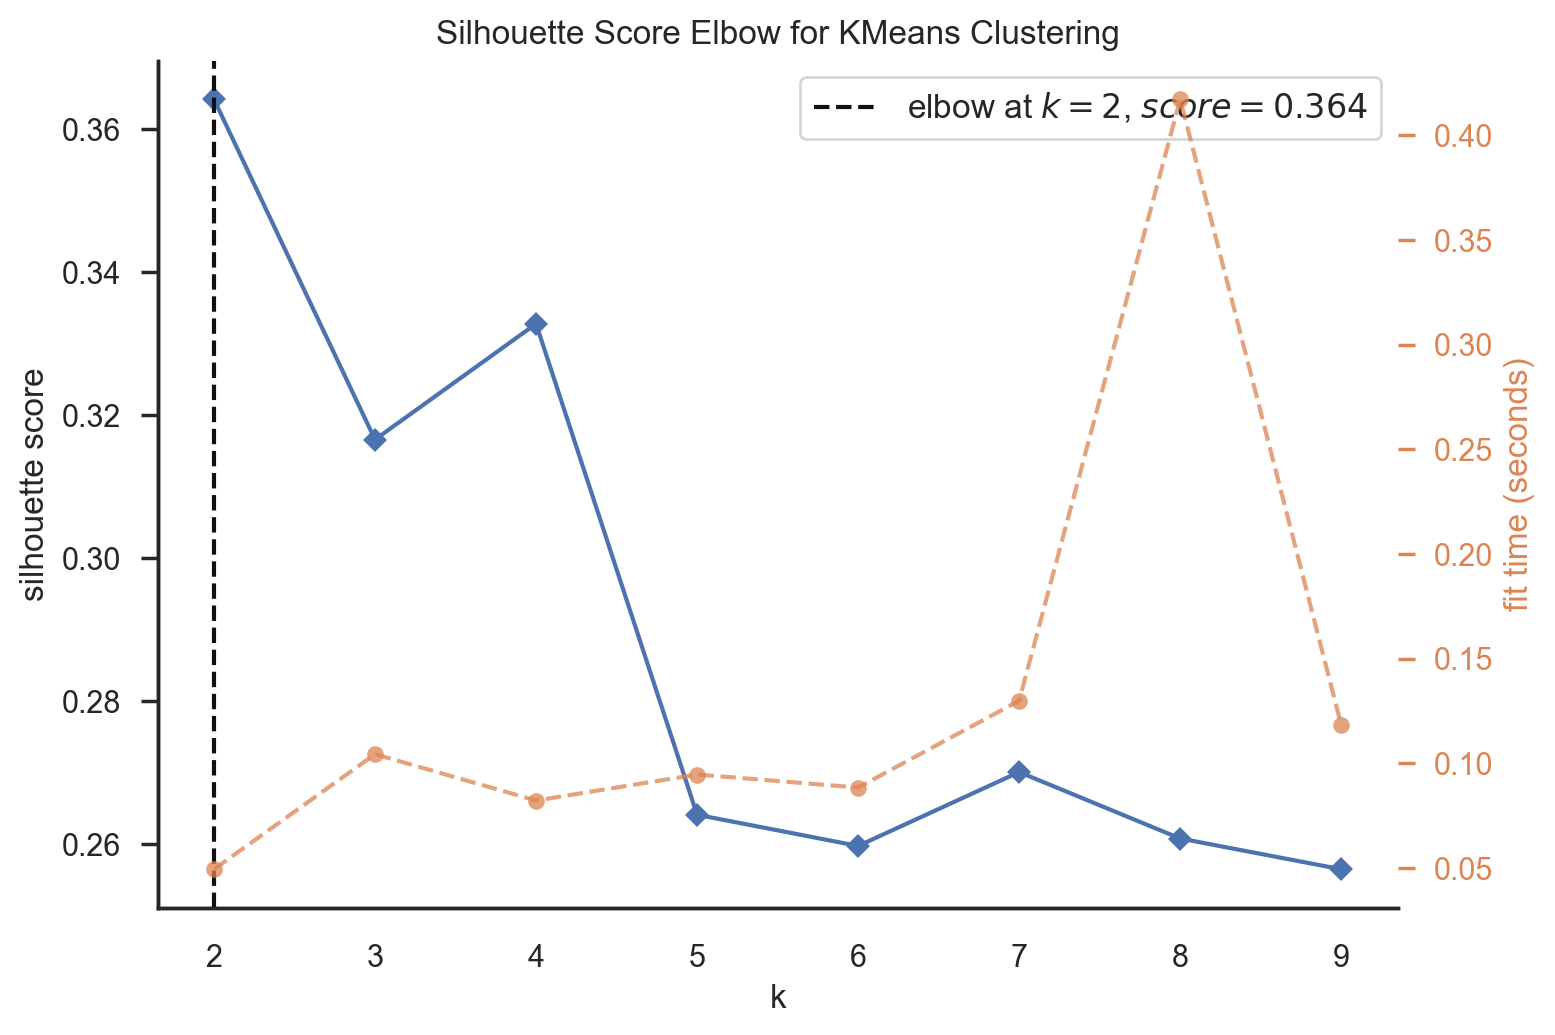
And finally get the 4 clusters. Then I plug these clusters into the dataset and generate some insights about these 4 clusters.
Customer Segments
The final result yielded four distinct customer segments:
- Segment 0: The Loyal Veterans
- Segment 1: The Budget-Conscious Shoppers
- Segment 2: The Affluent Aficionados
- Segment 3: The Silent High Rollers
Project Value and Reflection
This project was both challenging and rewarding. The need to redo preprocessing to generate an appropriate dataframe for PCA taught me the importance of data preparation in unsupervised learning. The final results, where customers were split into different segments effectively, were immensely satisfying.
I believe this project contributes significantly to understanding customer behavior and segmentation, enabling data-driven decision-making for businesses. It showcases the power of unsupervised learning techniques in the realm of customer analysis.