Data Analysis and Classification for Marketing Campaign Optimization
Overview
In this project, I present a comprehensive analysis and classification model for optimizing a marketing campaign’s success in promoting term deposits for a bank. The project is divided into three main parts:
Part 1: Introduction
I begin by providing an overview of the project, including the dataset’s origin, its features, and the problem definition. Additionally, I create a Table of Contents to help readers navigate the project.
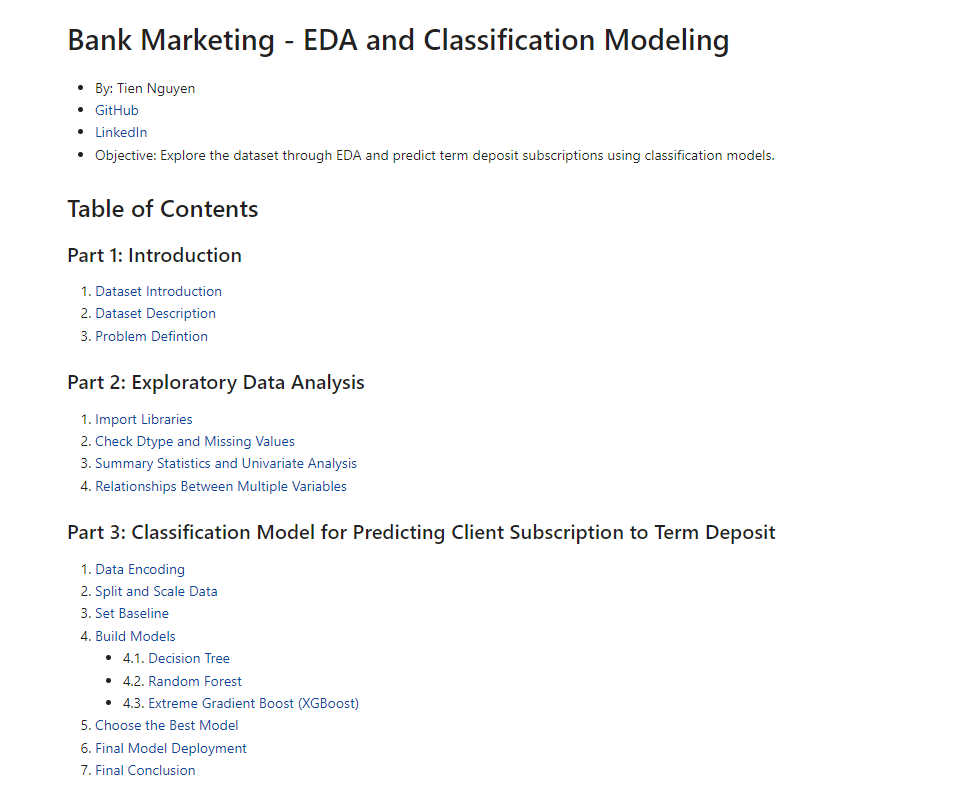 Figure 1: Introduction
Part 2: Exploratory Data Analysis
In this part, I delve into exploratory data analysis (EDA) and lay the foundation for the subsequent classification model.
- Univariate analysis explores both numerical and categorical features using histograms, box plots, and bar plots.
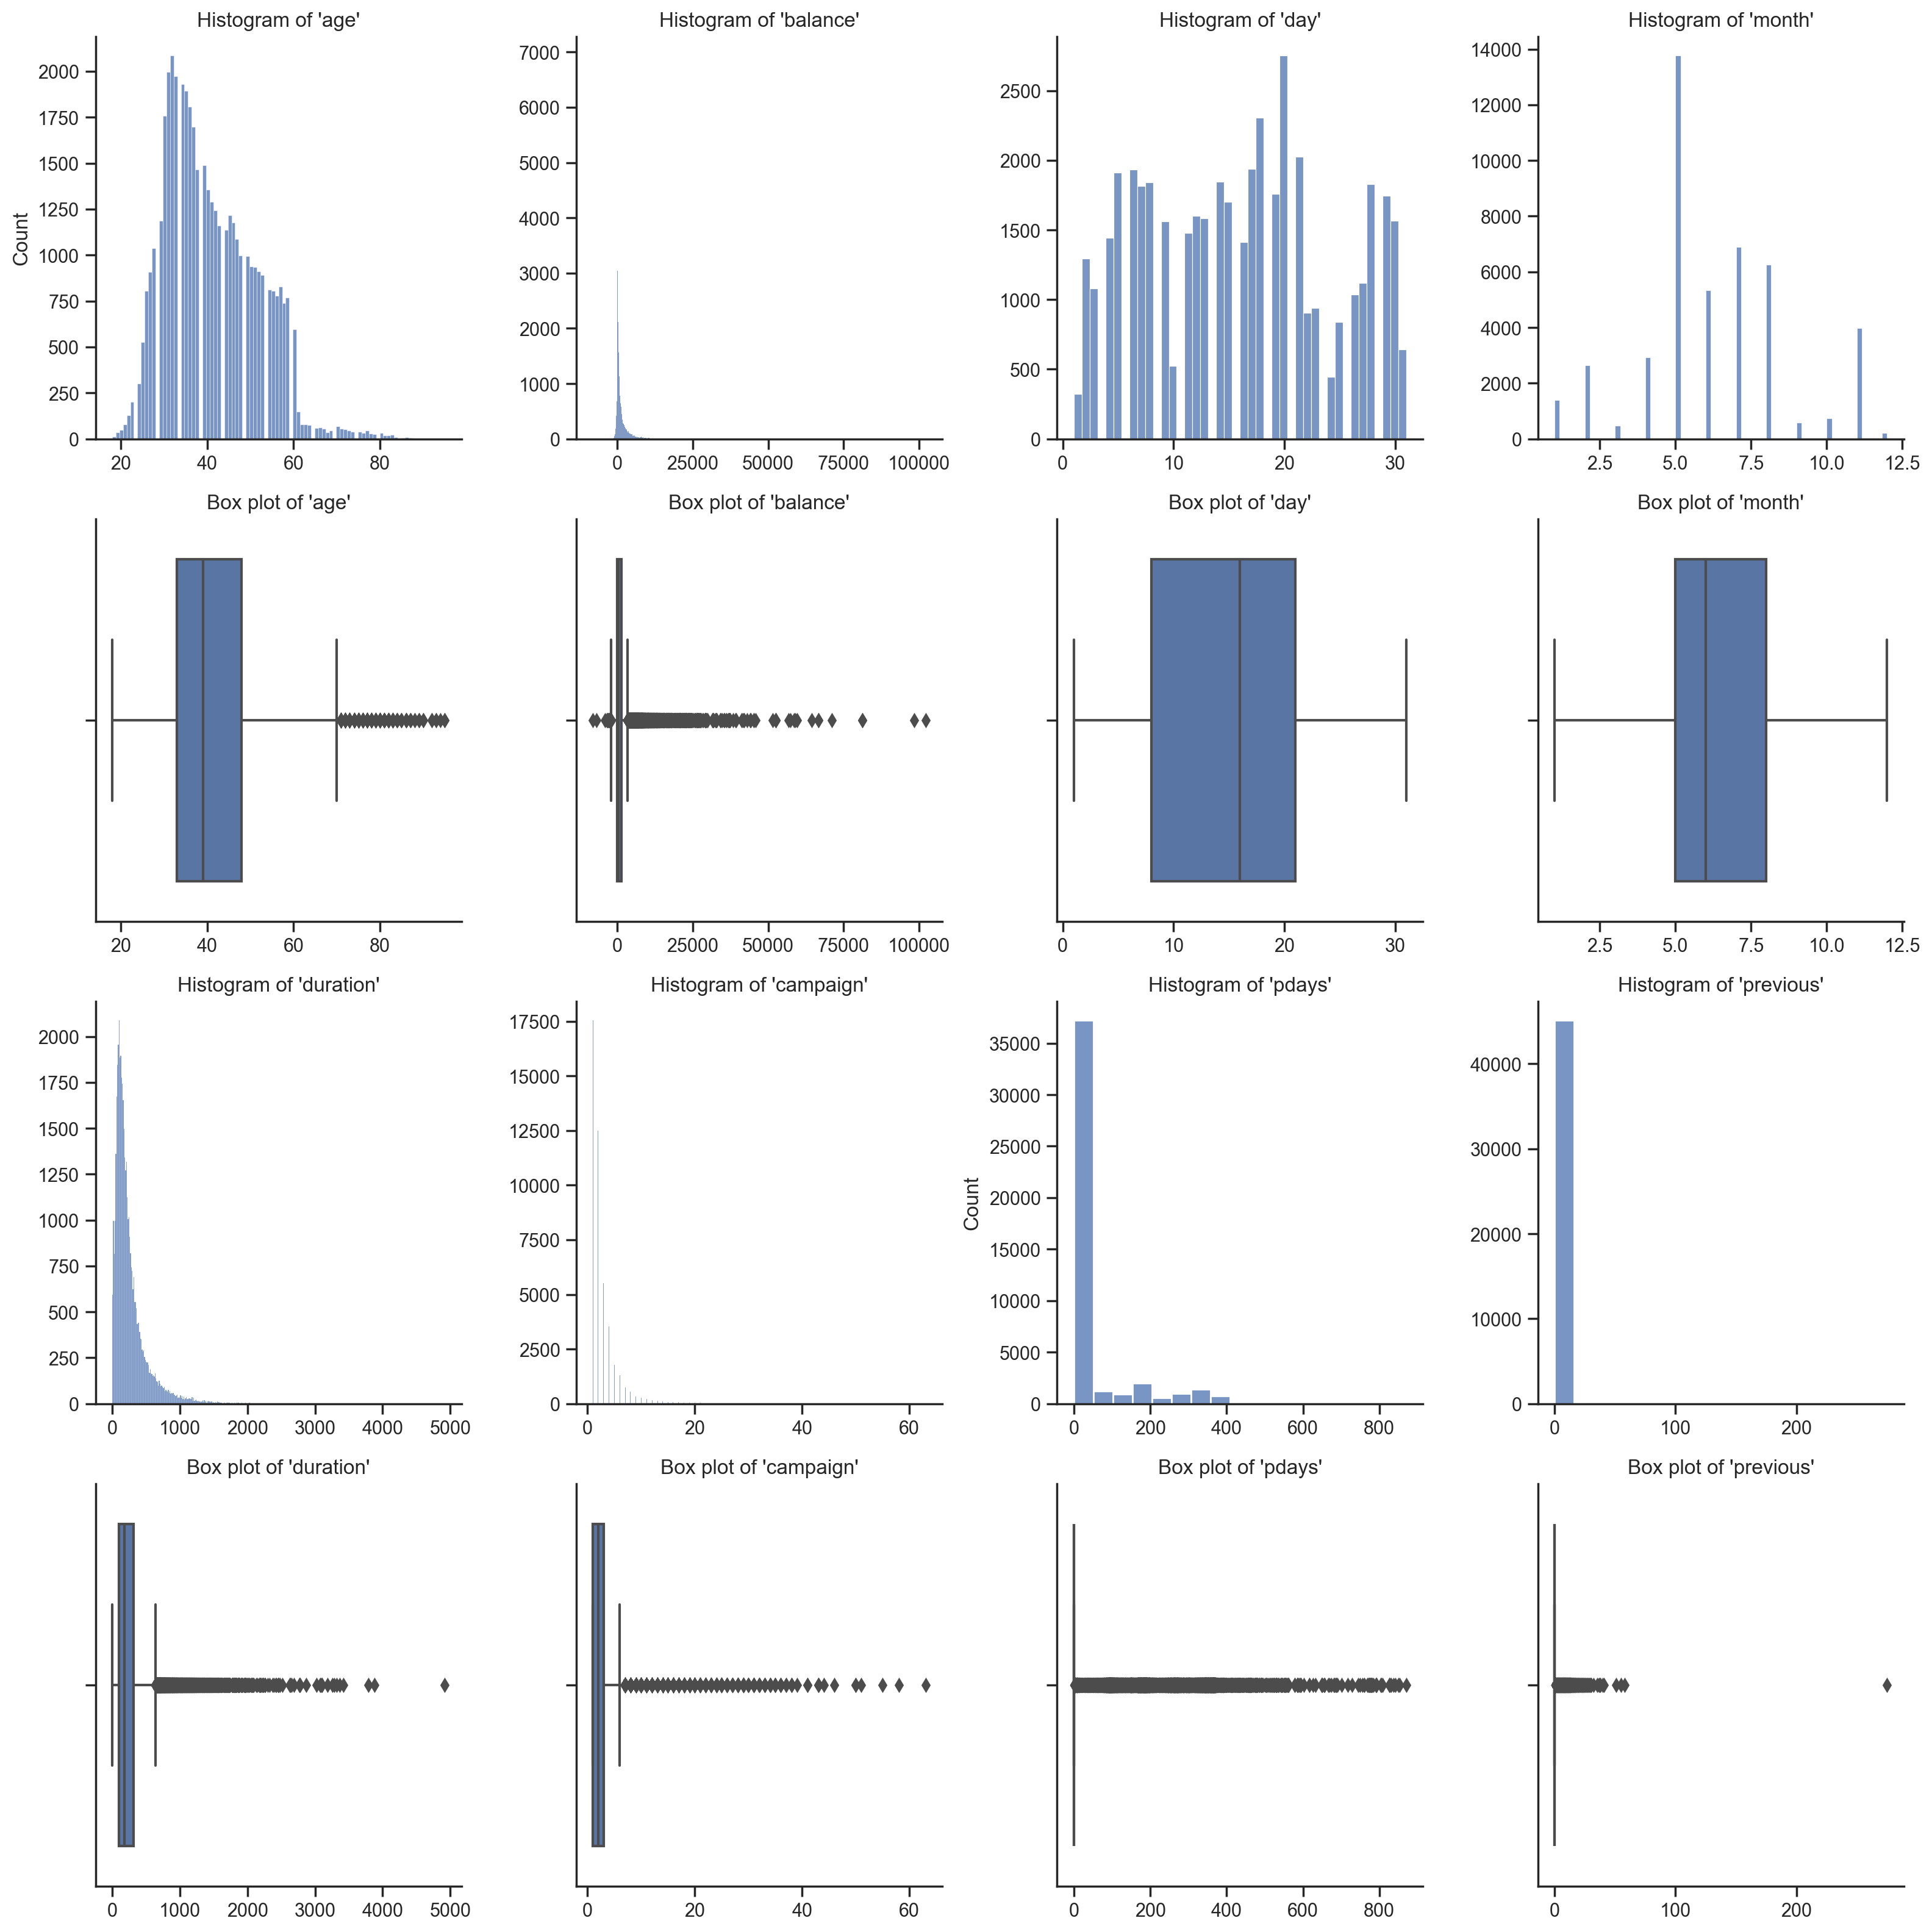 Figure 2: Numerical Features
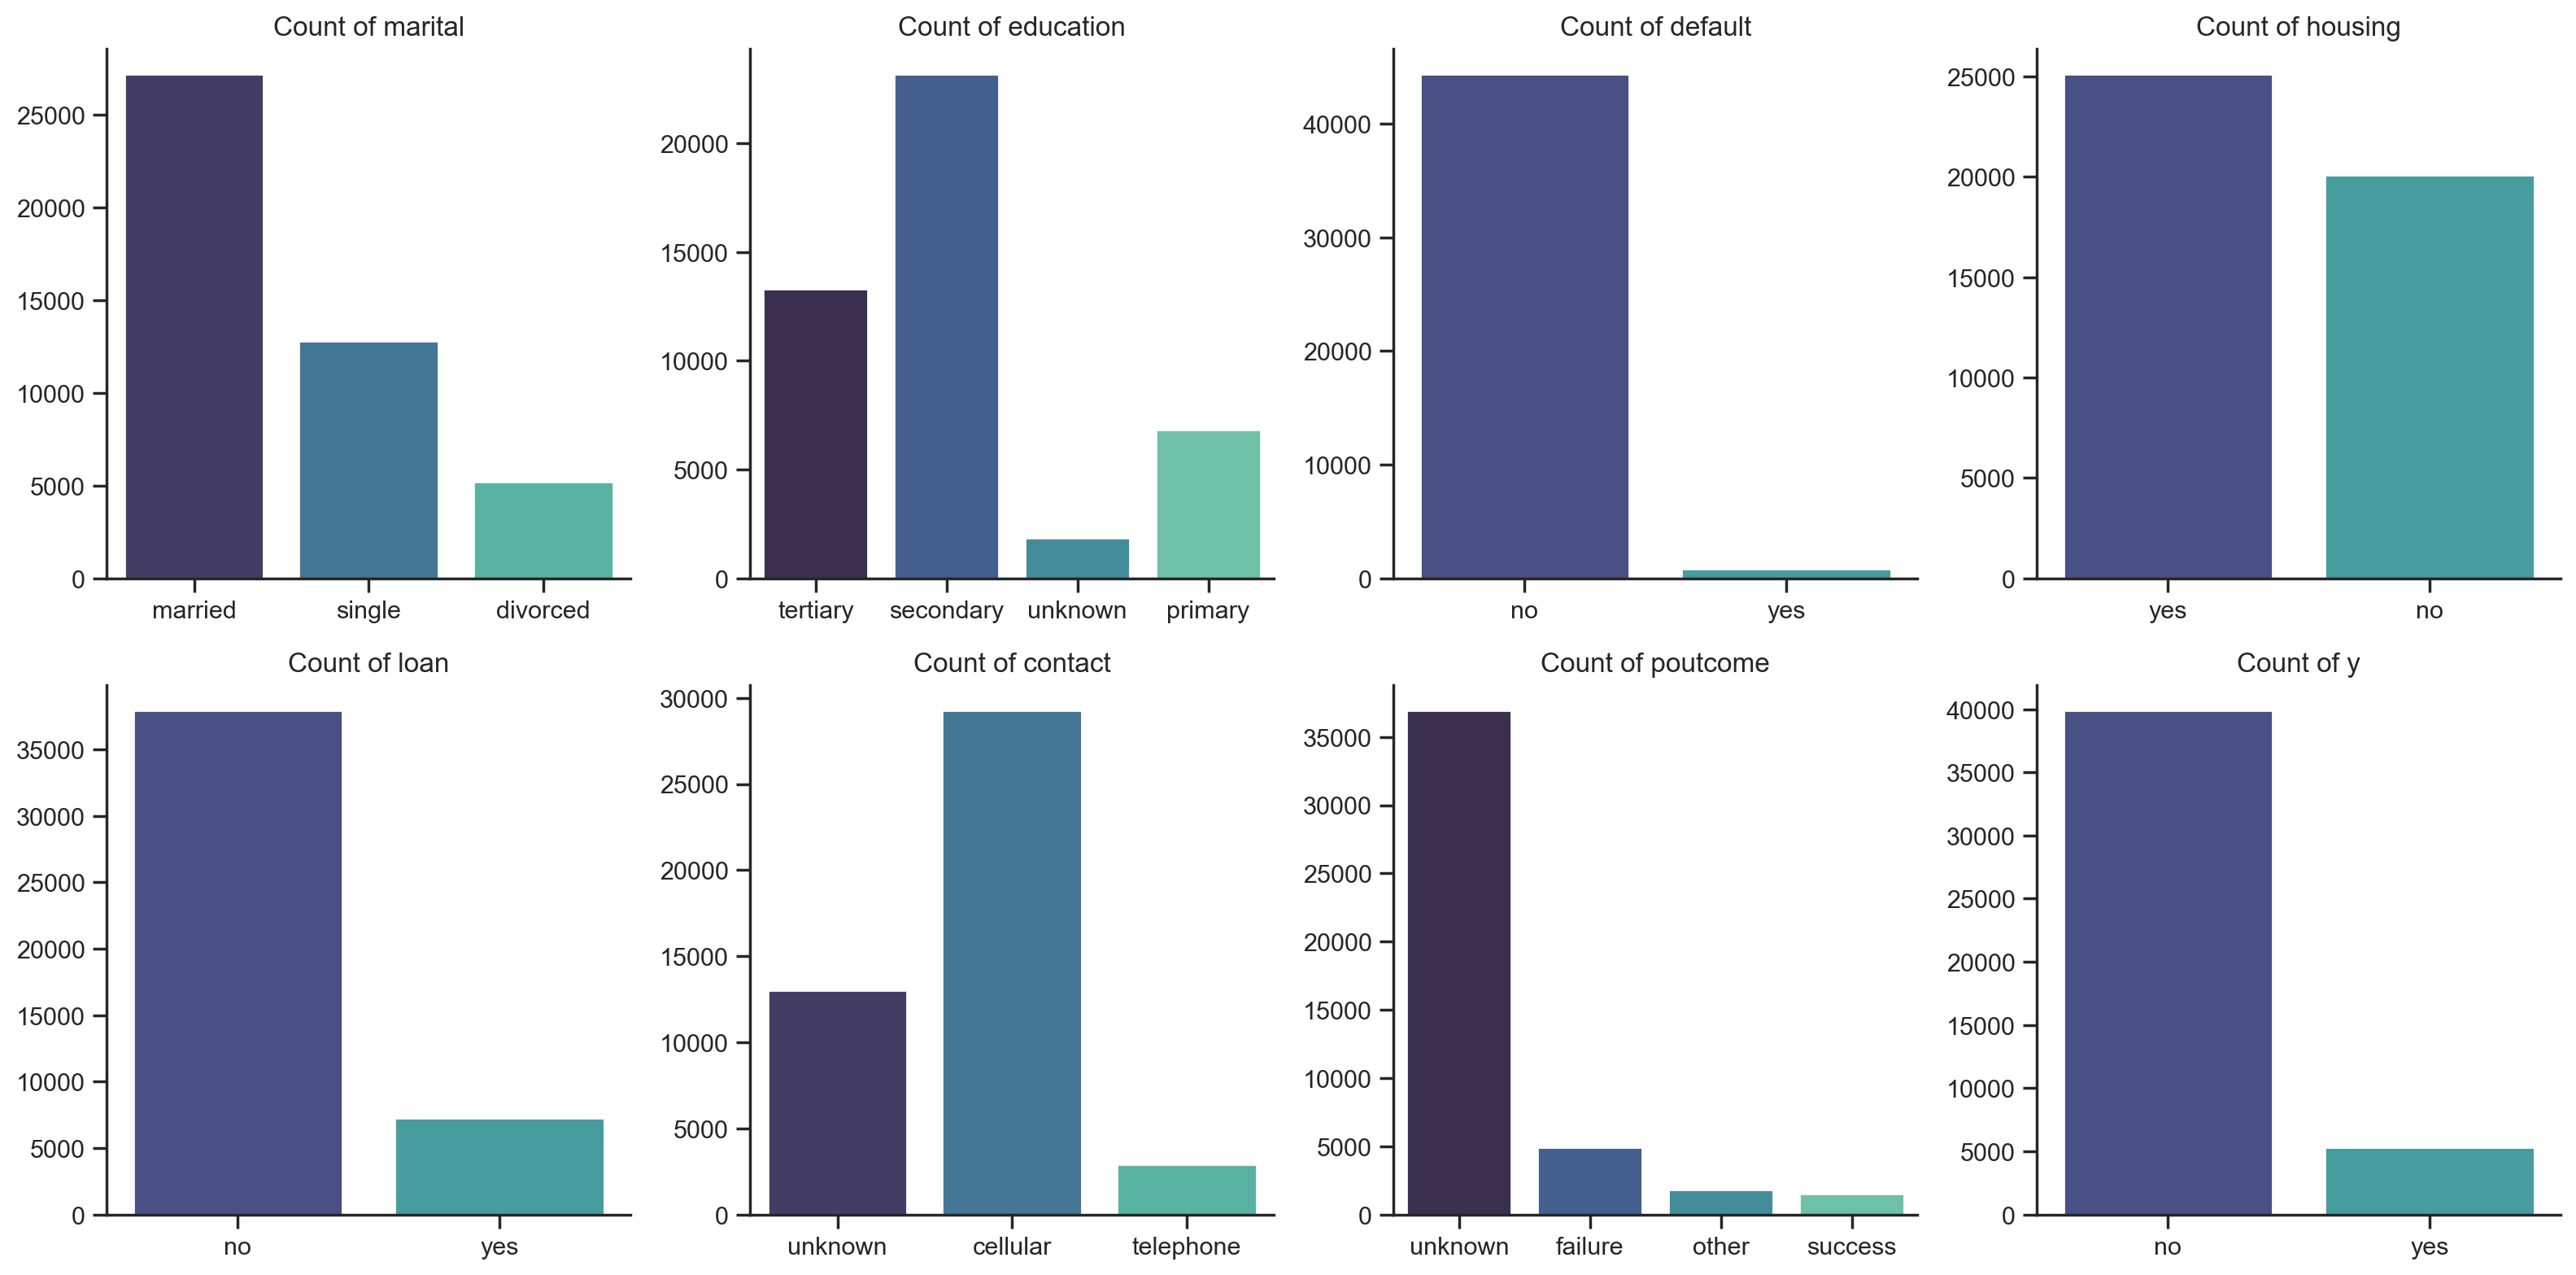 Figure 3: Categorical Features
- Relationships between multiple features are explored through various visualizations, including box plots, bar plots, time series (line plots), and a correlation heatmap.
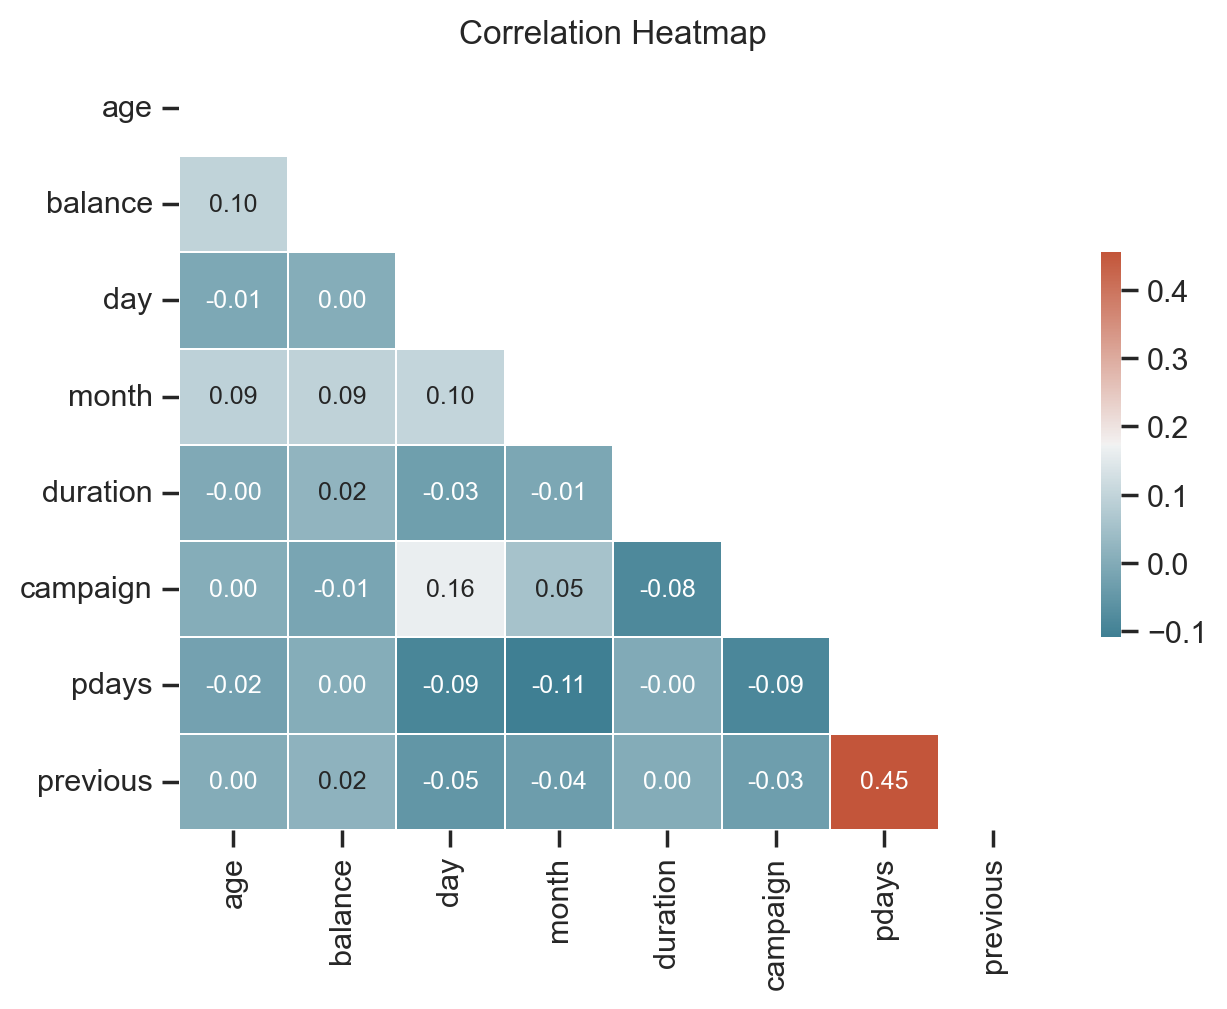 Figure 4: Correlation Heatmap
The analysis leads to significant findings, such as the influence of call duration on subscription success:
- If the call duration exceeds 700 seconds, the success rate of subscription notably increases to 53%.
Part 3: Classification Model
Having gained a thorough understanding of the dataset through EDA, I proceed to build a classification model to predict term deposit subscriptions.
- Data preprocessing, including data encoding, splitting, and scaling, is carried out to prepare the dataset for modeling.
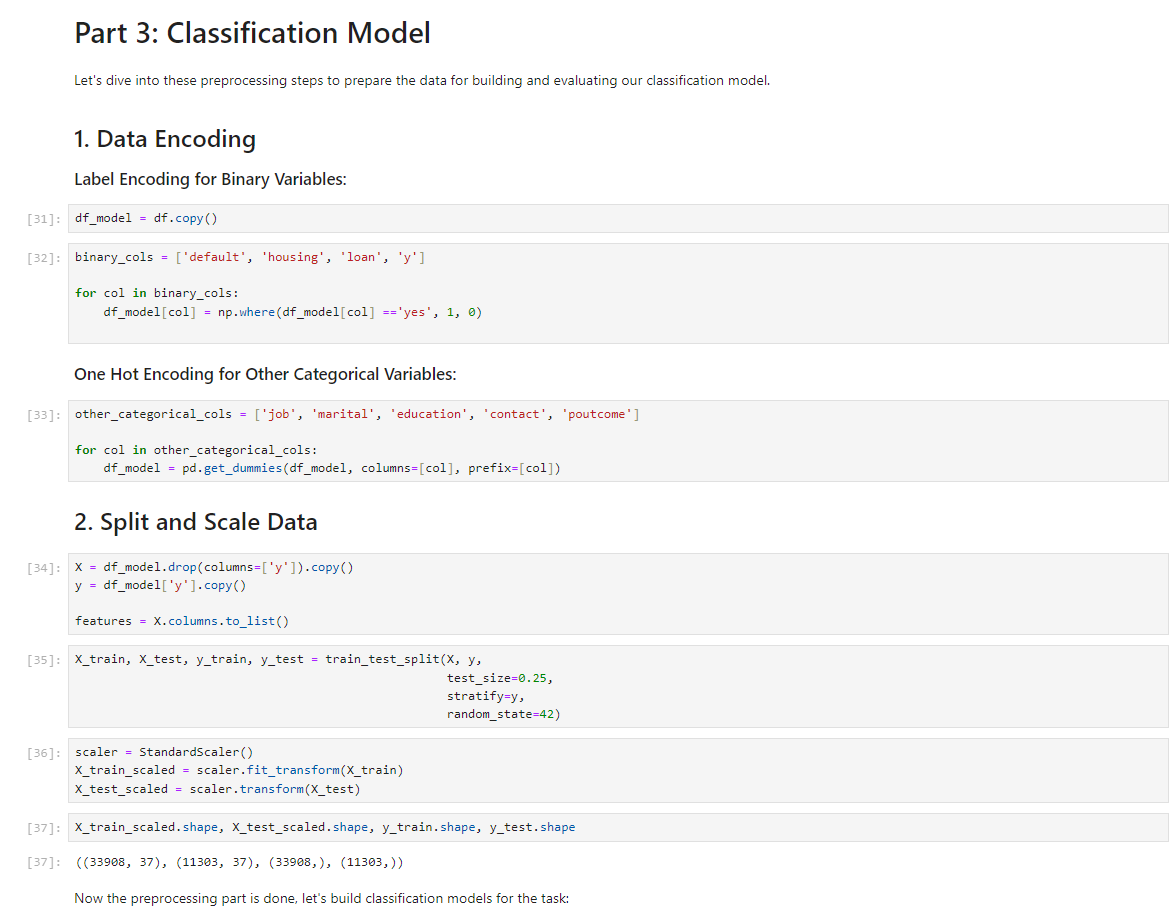 Figure 5: Data Preprocessing
- To address class imbalance in the target feature “y,” I use
stratify=yduring data splitting.
Building the model involves three key steps:
- Setting a baseline.
- Building different models, including Decision Tree, Random Forest, and XGBoost, with extensive hyperparameter tuning.
- Deploy the final model.
This phase is particularly interesting, as finding the best model involves deploying the gridsearchCV and can take more than three hours.
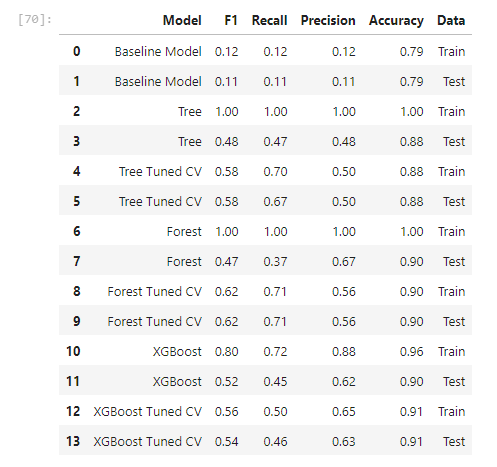 Figure 6: Model Comparison
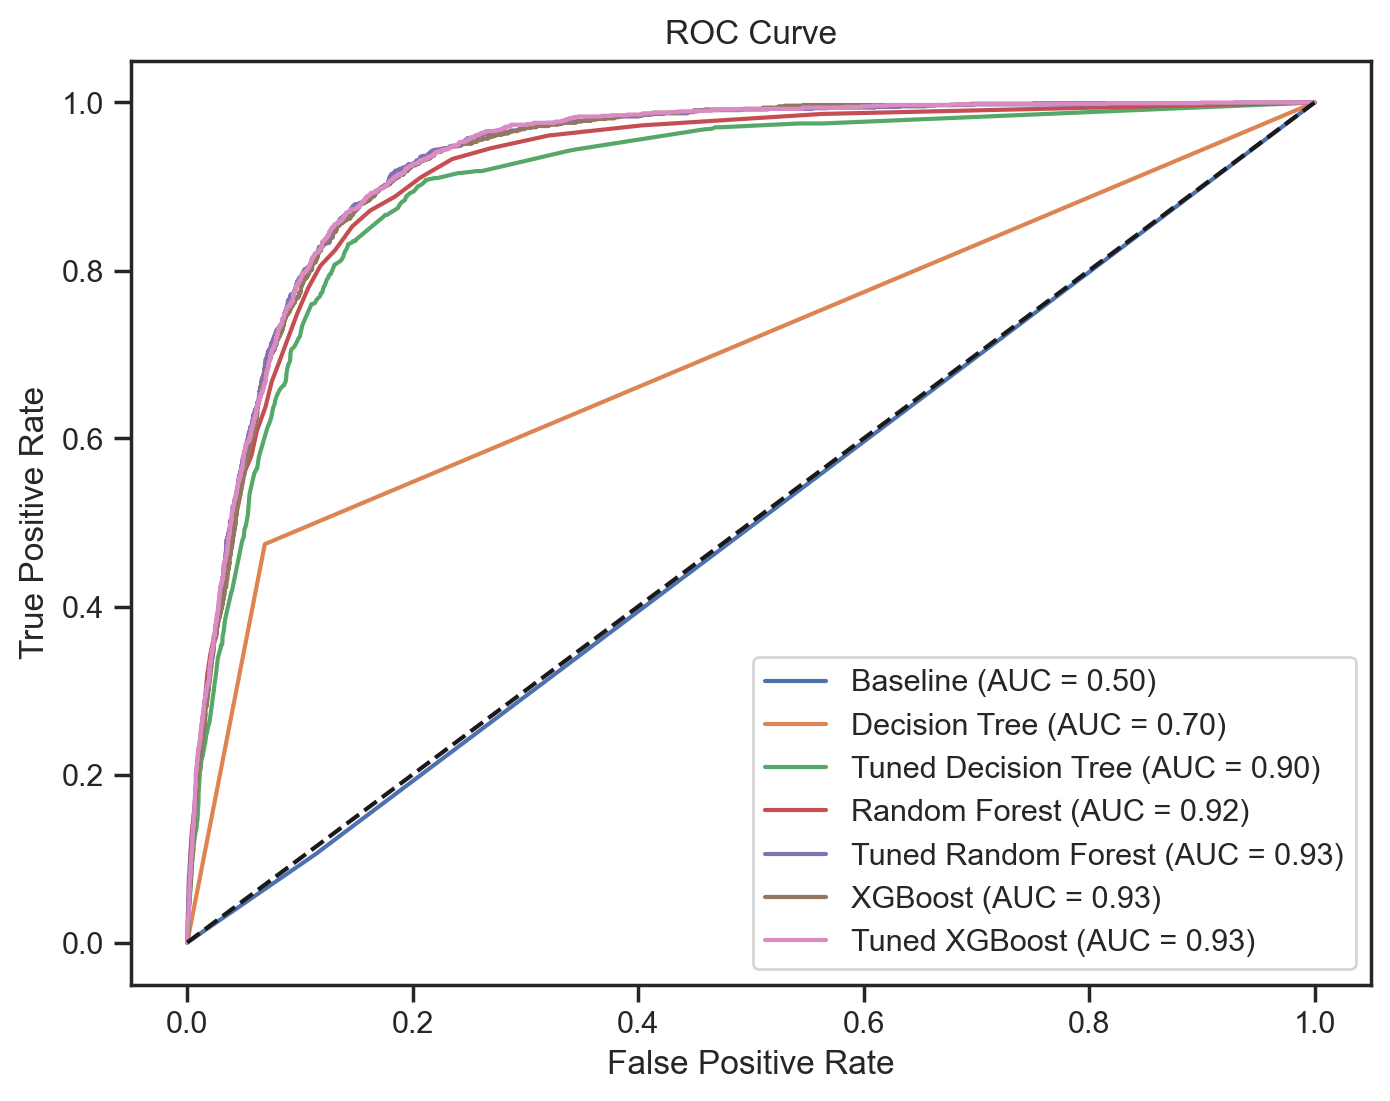 Figure 7: ROC Curve
The evaluation stage employs multiple metrics to select the tuned Random Forest model as the final model.
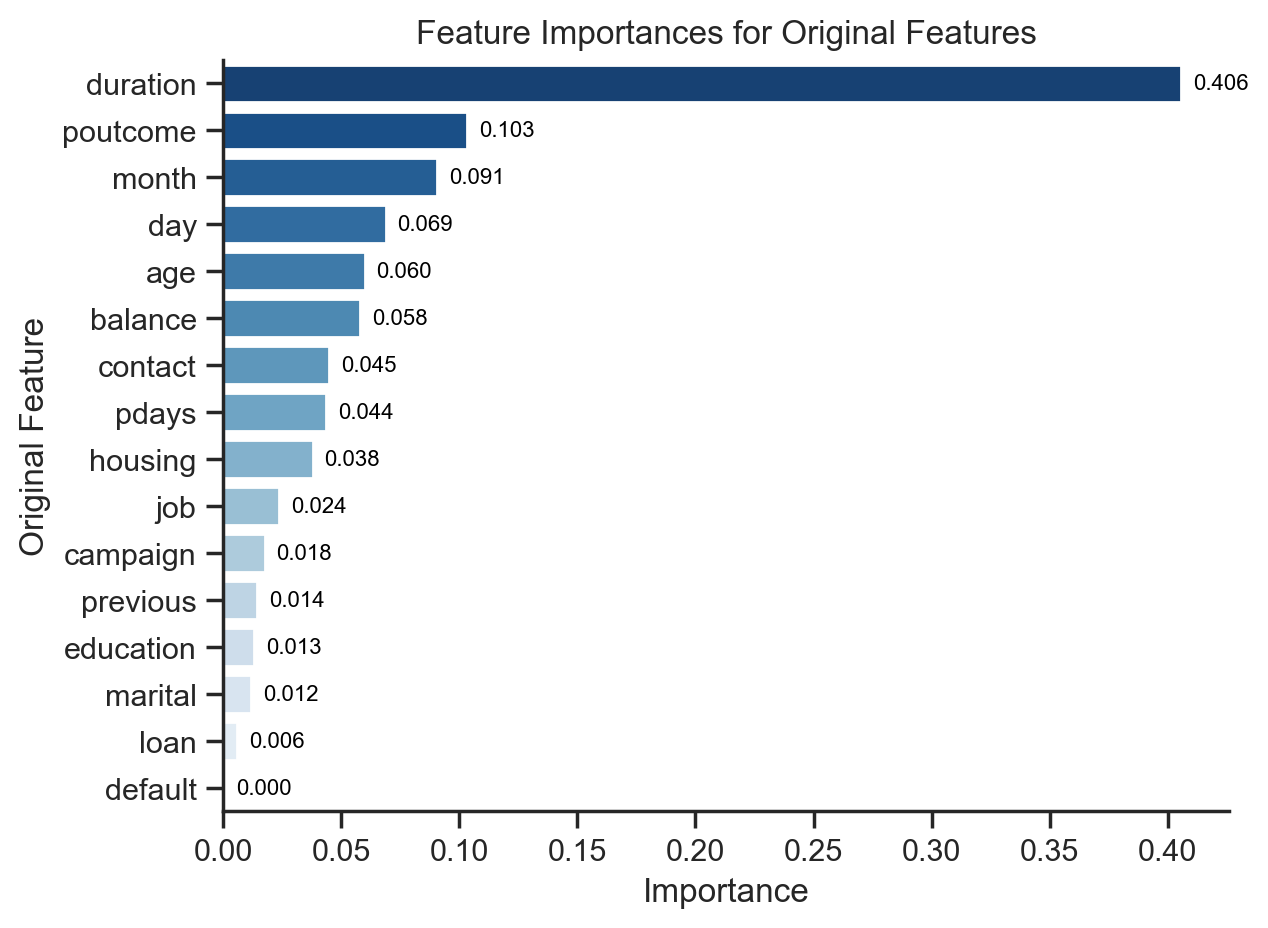 Figure 8: Top Features
Final Recommendations for the Next Campaign
Based on the analysis and feature importance, I provide actionable recommendations to optimize the bank’s marketing campaign:
- Avoid Default and Loan: Focus on clients without credit defaults and personal loans, as these categories have the lowest contribution to subscription success.
- Enhance Call Quality and Duration: Implement strategies to improve the quality of calls and increase call duration, as calls lasting around 4 minutes or longer yield the highest success rates.
- Target Previous Positive Respondents: Concentrate efforts on clients who responded positively in the previous campaign, as they are more likely to subscribe again.
- Strategic Timing: Plan campaigns to coincide with months that exhibit higher subscription rates (April to August), particularly targeting the middle of the month (around days 10 to 20) and periods at the end and beginning of each month.
These recommendations offer a strategic framework for optimizing the bank’s marketing campaigns and enhancing subscription rates for term deposits.
This project showcases a robust data analysis and machine learning approach, demonstrating a strong understanding of data science principles and their practical applications.